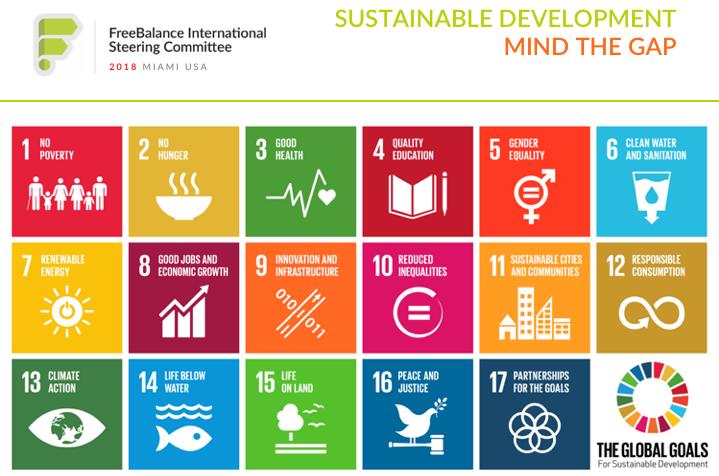
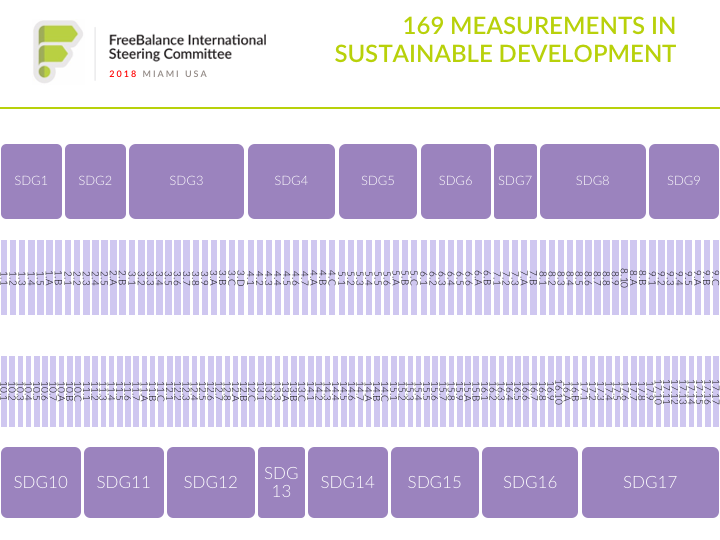
![]() How can governments achieve the Sustainable Development Goals (SDGs)? It’s a tall order. 17 goals, 169 measures. Incomplete measures: many proxies and subsets. It makes for a gap between aspiration and reality.
How can governments achieve the Sustainable Development Goals (SDGs)? It’s a tall order. 17 goals, 169 measures. Incomplete measures: many proxies and subsets. It makes for a gap between aspiration and reality.
We know something about government performance management at FreeBalance. We know that 17 major goals are too many to rationally manage and track performance. We also know that too many goals makes performance sub-optimal on all.
Professor Matt Andrews, at the Harvard Kennedy School, likens it to a Christmas tree with many small ornaments. The result is lack of progress because effort dissipates across ornaments. Countries that have achieved economic, human capital, and wellbeing success focused on smaller sets of goals. Fewer ornaments. Bigger ornaments.
SDGs and Government Performance Management: Wicked Problems
his SDGs conundrum was top of mind at the 2018 FreeBalance International Steering Committee (FISC) conference last month in Miami. Our approach this year was to link the wellbeing policy advice from the Government-focused H20 conference on the first day, with subsequent days looking at SDGs 11, 13, and 16.
Attendee workshops examined agile government innovation practices following:
- SDG 13: Climate finance, and climate resilience
- SDG 16: PFM impact on good governance, with additional session of impact of digital technologies
- SDG 11: Smart infrastructure and smart public investments
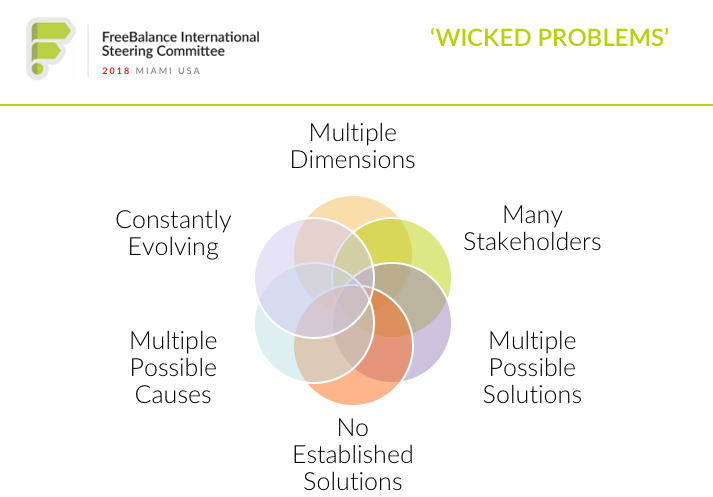
As described in a previous blog post, SDGs are“wicked problems“, or “social mess“. The social mess, as described by Robert Horn, includes the following characteristics:
- No unique “correct” view of the problem
- Different views of the problem and contradictory solutions
- Most problems are connected to other problems
- Data are often uncertain or missing
- Multiple value conflicts
- Ideological and cultural constraints
- Political constraints
- Economic constraints
- Often a-logical or illogical or multi-valued thinking
- Numerous possible intervention points
- Consequences difficult to imagine
- Considerable uncertainty, ambiguity
- Great resistance to change
- Problem solver out of contact with the problems and potential solutions
The SDGs represent 17 “moonshots“. We described our thinking in February about the need for context to select appropriate goals. And, the need to use public finance systems to manage performance.
Governments need to select appropriate ornaments.
Government Gaps Context
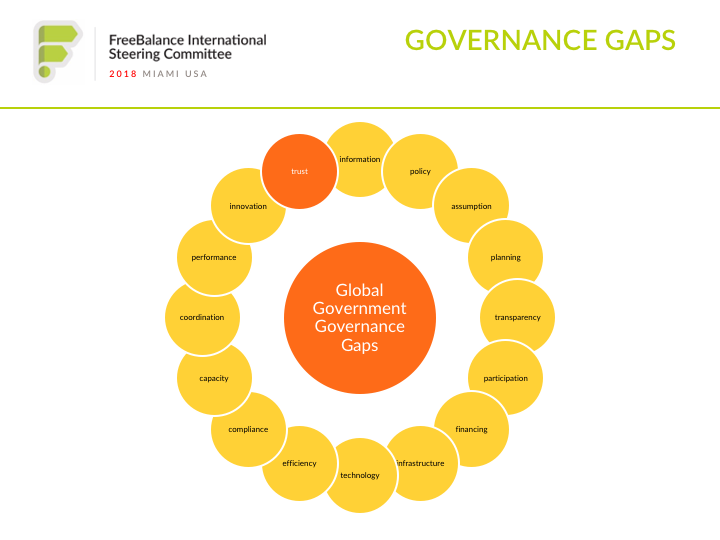
We use “governance gaps” to identify opportunities and constraints for government performance improvement. Our discussions with FISC attendees helped us expand our governance gaps analysis to 16 items:
- Information Gap: Lack of effective, consistent, coherent, timely, and quality information for decision-makers because of data silos, lack of data collection, with poor information governance and integration, rather than effective unified data
- Policy Gap: Policy is informed by the information gap, so policy reverts to political dogma, or effective unified data is downplayed in favour of dogma because of confirmation bias, rather than policy aligned to citizen priorities, or citizen-centric policy
- Assumption Gap: Government policy and planning is often informed by so-called “best practices” that are unaligned to the government context and realities, or the real needs of citizens
- Planning Gap: Focus on annual budgets rather than medium term, combined with the information gap and policy gap leads to short-term planning where priorities that are misaligned to citizen concerns, even if understood, and effective unified data, if collected
- Transparency Gap: Lack of fiscal transparency or usability of transparency information even when planning is effective and priorities are aligned to citizen needs
- Participation Gap: Lack of citizen engagement because of limited participation, poor fiscal transparency, and antiquated planning methods that does not tap into citizen, civil society or business capacity to solve problems and identify policy priorities, even when governments have unified data and effective planning techniques
- Financing Gap: High debt and limited financing option challenge governments to invest in citizen priorities, especially when previous planning has led to poor outcomes
- Infrastructure Gap: Trillions of dollars of additional infrastructure investments are needed annually to achieve sustainable growth, where the proven economic returns for infrastructure cannot be financed even when there is effective planning
- Technology Gap: Lack of modern integrated information systems in government, with antiquated legacy systems and legacy ERP, leads to the information gap for decision-makers, particularly for measuring policy success, while making fiscal transparency difficult, with high technical debt and maintenance costs that restricts spending for new cost-effective systems
- Efficiency Gap: Antiquated and manual government processes from the pre-digital era, and legacy technology adds friction to government service delivery
- Coordination Gap: Government organizations often operate in silos where missions are unaligned to national objectives, with counter-productive spending, that does not leverage other government initiatives
- Compliance Gap: Manual processes and legacy technology leads to inadvertent compliance gaps such as overspending procurement or payroll budgets through lack of budget integration, or deliberate compliance breaches such as corrupt practices in procurement and tax collection
- Capacity Gap: Focus on antiquated processes, legacy technology, and the top-down focus of government human resources often leads to public service capacity that falls behind private sector capacity leading to poor planning decisions
- Performance Gap: Legacy technology, poor capacity, investments, and planning, leads to government performance that does not meet citizen expectations even when citizen priorities are understood
- Innovation Gap: Conservative focus in public investments leads to inefficient complex procurement resulting in legacy technology and infrastructure adoption, and program implementation saddled by poor planning that is not tied to citizen priorities
- Trust Gap: Lack of citizen engagement, public sector corruption, poor transparency and performance erodes trust in government leading to lower credit ratings, poor tax compliance, and increased conflict
Governments suffer from one or more of these gaps. Gaps are self-supporting, so the ability to close a gap reduces other gaps. This analysis identifies realistic government goals.
Smart Prosperity and SDGs
Happiness and wellbeing in public policy is about the intersection of economic growth, environmental sustainability, good governance, and citizen service delivery. It’s about “smart prosperity”. Prosperity that meets cultural values.
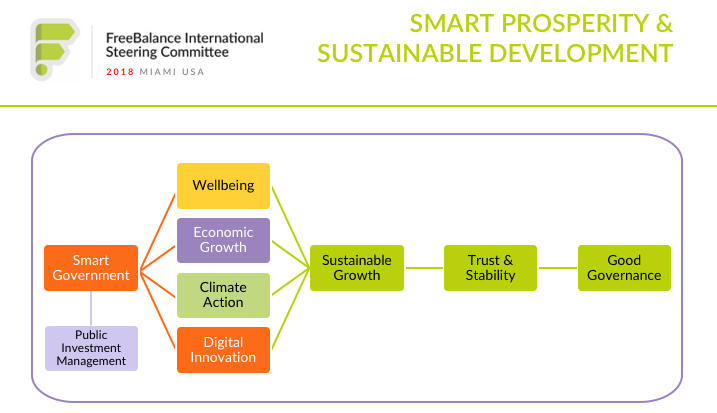
The “Smart Prosperity” helps governments to simplify public policy. It helps define “sustainable growth” in the country context. These link to appropriate social and physical public investments. And, shows the impact of good governance to achieve goals. It’s not so much about achieving some SDG16 measures like “16.1.2 Conflict-related deaths per 100,000 population, by sex, age and cause”. It’s about identifying governance actions that can aid in sustainable growth.
Tools like the “Balanced Scorecard” simplify performance management through strategy maps. Governments focus on few ornaments. And, map out how the ornaments work together. We explored wellbeing balanced scorecard design at FISC 2017.
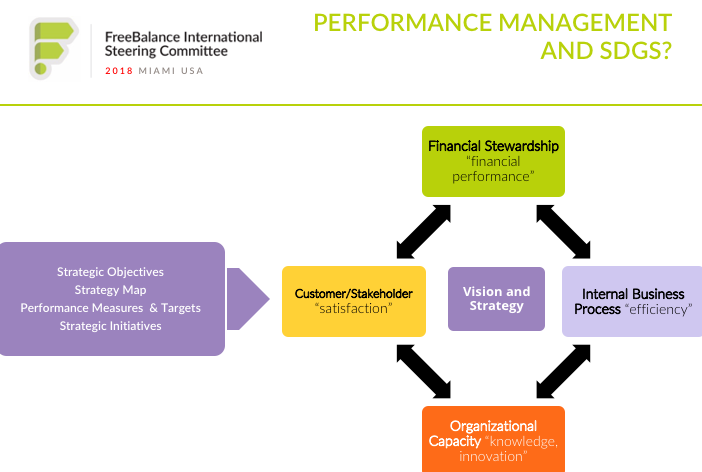
Public Financial Management for SDGs Performance Management
Performance concepts can be aligned in public financial management systems by adapting budget classifications, or the Chart of Accounts (COA). If helps when the GRP software has a multiple year COA to add program and performance structures.
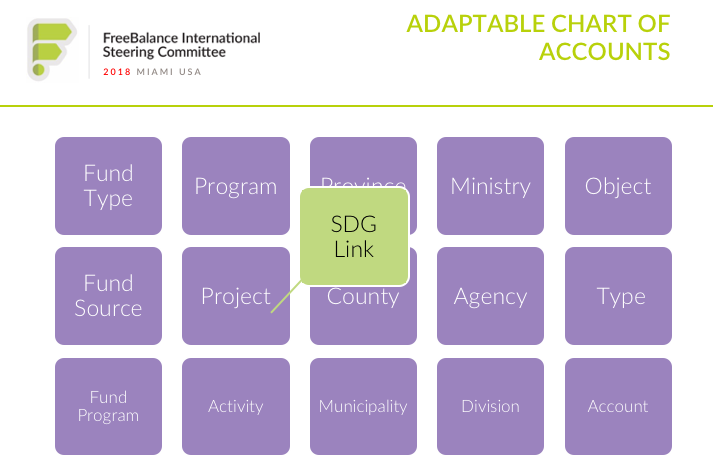
Spending against SDGs can be embedded in the COA, typically the program segment. This is accomplished through identifying project or program ranges that apply to government objectives, including SDGs. It acts as an alternative roll-up from detailed information than accounting classifications.
This enables reporting against spending, without impacting those who enter the data.
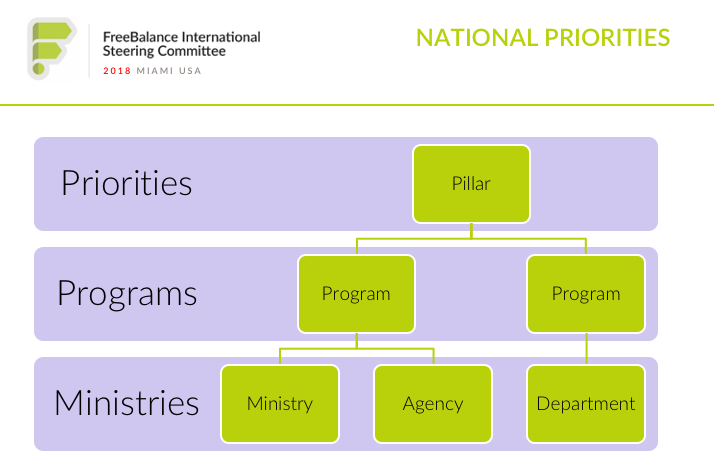
Priorities can cascade hierarchically across programs, using program budgeting concepts. Coordination improves as Ministries, Departments and Agencies share programs. This can be aligned with results – output and outcome objectives – in a ‘Chart of Goals.’ FISC 2018 attendees learned how Charts of Accounts hierarchical structures can align with Charts of Goals hierarchical structures.
Smart Prosperity Virtuous Circle
We explored climate resilience budgeting and SDG13 at FISC 2018. The discussion of SDG11 including opportunities with natural resources revenue. FISC attendees were intrigued with an emerging practice of accounting for natural resources, such as forests and oceans. Sustainable Prosperity should account for natural resource potential, and natural resource degradation.
It’s high time for government accrual accounting innovation that articulates natural capital.
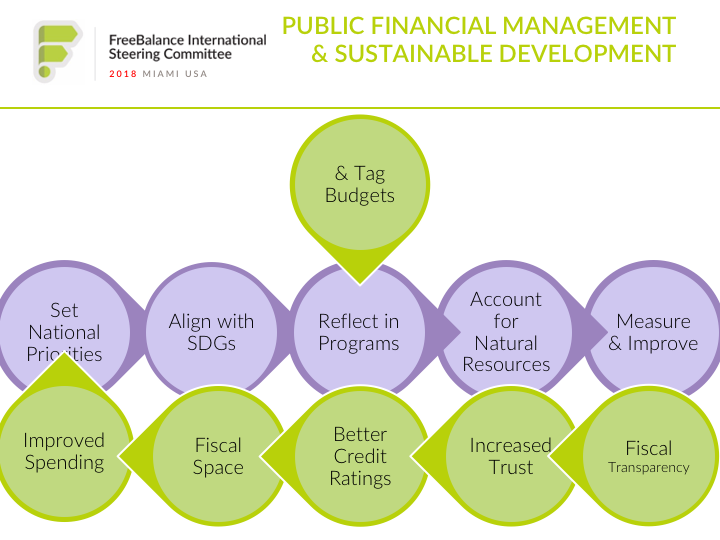
A public finance virtuous circle for SDGs that includes climate financing includes:
- Setting relevant national priorities first
- Aligning priorities with appropriate SDGs
- Reflecting priorities in programs and program budgeting
- Tagging budgets with alternative heirarchies and integrating Charts of Accounts with Charts of Goals
- Leveraging financial and performance information for improvement
- Demonstrating activities, spending and results transparently
- To increase trust in government
- Including among credit bureaus
- To increase fiscal space
- To increase spending and spending effectiveness
Towards Smart Public Investment Management
There is an infrastructure gap measured in Trillions of Dollars, according to McKinsey. Yet, infrastructure has a Return on Investment, conservatively estimated at between 1.5 to 1 and 3 to 1. That’s traditional infrastructure – not the new generation of “smart infrastructure” enabled by sensors to reduce energy consumption or improve traffic patterns. And, that doesn’t include the Economic Value Add to businesses and people.
There’s also a gap in social infrastructure: health, education, and social services. For example, Lord Richard Layard presented compelling evidence of the ROI for smart mental health services at the H20.
FISC 2018 discussions about SDG11 focused on smart and integrated public investment management. Public investments tied to government goals.
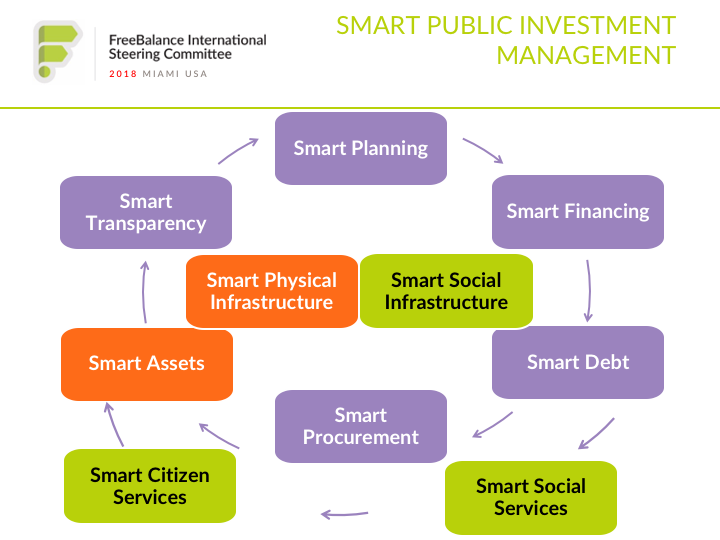
The beauty of embedding performance and government goals in public finance classifications is tracking the cycle of planning, financing, debt, assets and transparency. Of linking the ornaments.